
Evolution
/evolution reads everything you own, over everything you hold history for: the two
charts and the three figures on it all answer how has my wealth moved, and what is it
made of. The dashboard asks the same question over a window
you choose; this page always answers it over the whole history.
There is nothing to set: the page has no period chips, no category filter and no gross-and-net switch. Each point on either chart is the last day of a month.
The three figures
Section titled “The three figures”| Figure | What it says |
|---|---|
| Current net worth | What you are worth today, the same figure the wealth screen shows. |
| Change since … | What the history earned, with your own payments in and out taken out of it. |
| Worst drawdown | The worst fall from a peak the curve ever took, and the day it was reached. |
The middle label names the day it is measured from: the oldest point your history holds, not the day you opened your oldest account. The two are rarely the same, which is why the label spells the date out instead of saying “since the start”.
The drawdown is measured on the whole net worth, so a withdrawal counts as a fall like any other and no single account carries the figure. It is blank until the curve has been above zero: someone who started with a mortgage and nothing else is not told they are at a peak.
Allocation drift
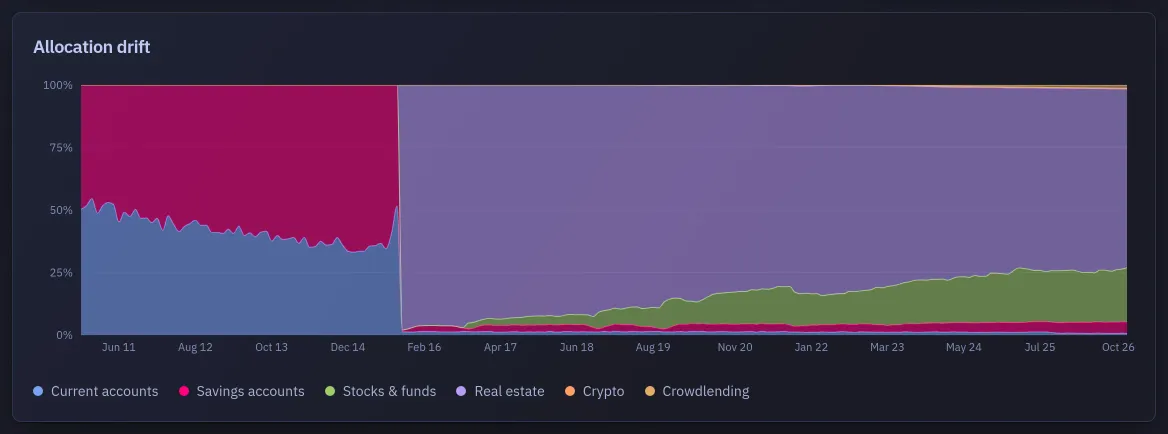
Section titled “Allocation drift”The first chart is a hundred-percent stack: each band is one of the ten wealth categories, and the height of a band is its share of what you own that month. It shows over the years what Accounts shows for today.
Two things about the shares. A category is drawn only if you have held something in it at some point, so the chart has no empty band. And the shares are taken on your gross assets: a loan or an overdraft is a negative share, which a stack cannot draw, so liabilities are left out of this chart and read on the next one.
Portfolio evolution
Section titled “Portfolio evolution”The second chart stacks Cash and Other assets under a Net worth line. Cash is your current accounts and savings books; Other assets is everything else you own: shares and funds, but crypto, property, crowdlending and objects too. The hover adds Loans and debts as a negative when you carry any, which is why the stack can stand taller than the net line.
A dashed segment with a hollow point marks a day recorded while at least one holding had no price: the figure for that day is understated rather than wrong, and the legend says so whenever the curve has one. A note under the chart counts those days, and Rebuild the missing history goes back over them with the prices it can fetch now. A second note counts the days rebuilt from a price but with today’s quantities, for want of a dated lot. Those describe a portfolio you may not have held yet.
Markers puts the dates of your journey under this chart: a dotted line through the curve and a button under the axis for a marriage, a purchase, a loan. Hovering one shows what happened and what the gross wealth, the debts and the net did that month, so a step in the curve comes with its explanation. Clicking a point of the curve offers to add a marker that month.
Before there is a curve
Section titled “Before there is a curve”The page is empty until an instance has recorded its first daily point, which happens overnight. Until then it says so, and points you to the only thing that fills it: an account with a value in it. The curve needs a few months of points before it means much.